Advanced analytics

Main page - general overview regarding functionalities & version history

Gadget which allows you to sum up data and display result in a bar chart

Gadget which allows you to sum up data and display result in a pie chart

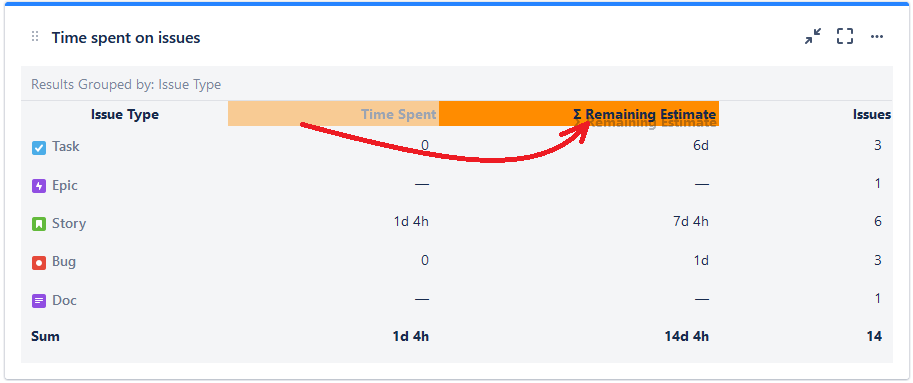
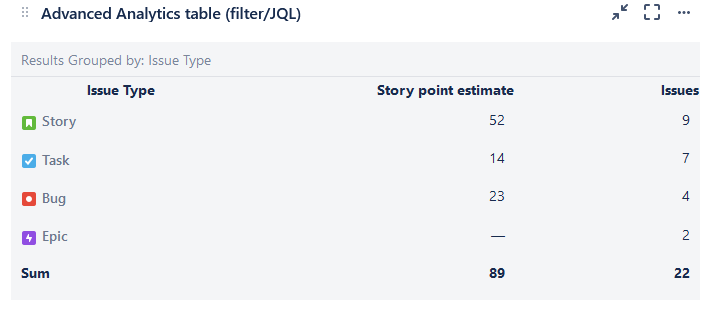
Gadget which allows you to sum up data and display result in a table

Gadget which allows you to sum up data and data in a 2-d table
Sum up data using table gadget
Create tables containing data with multiple statistics. With this functionality, you can analyse whatever you need to.
Configuration
- Go to dashboard on which you're willing to place the Gadget
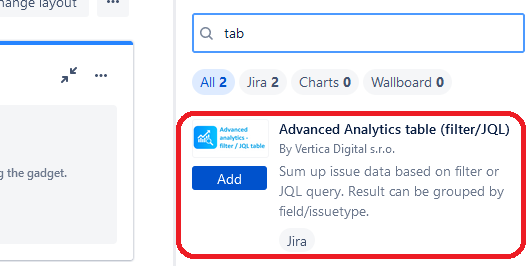
- Add Gadget called "Sum up table (filter/SQL)" to the dashboard
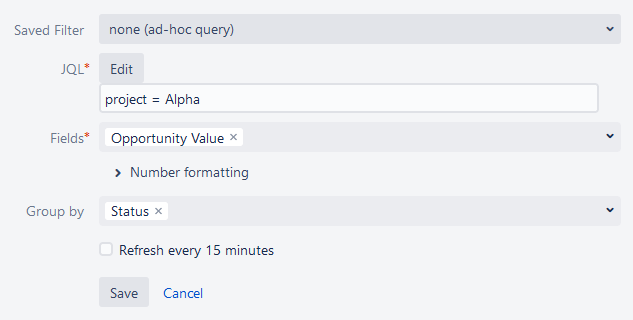
- Fill in the details on the gadget configuration screen
- Saved filter (optional)
- JQL - select data you want to show in the table
- Fields - select the fields you want to display in the table
- Group by - select parameter based on which you want to group your data.
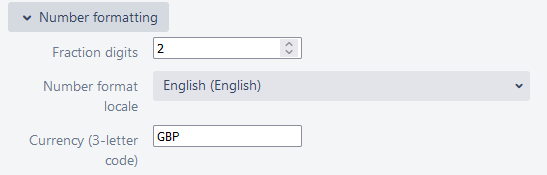
- Number Formatting (Optional)
- Fraction digits [optional] - select number of decimal places to be used
- Number format locale [optional] - please select type of number formating
- Currency (3-letter code) [optional] - please insert of the desired currency (i.e. EUR, GBP,...) - please see full list here
5. Click on button "Save" and now you see statistics you wanted :)
Changing row order
If you want to change order of the rows, you can use drag&drop functionality directly on the dashboard