Sum it up!

Main page - general overview regarding functionalities & version history

Set up your Jira® to sum values from source to destination fields

Gadget which allows you to sum up data and display result in a table

Gadget which allows you to sum up data and data in a 2-d table

Plan workload of your team members using our planning gadget
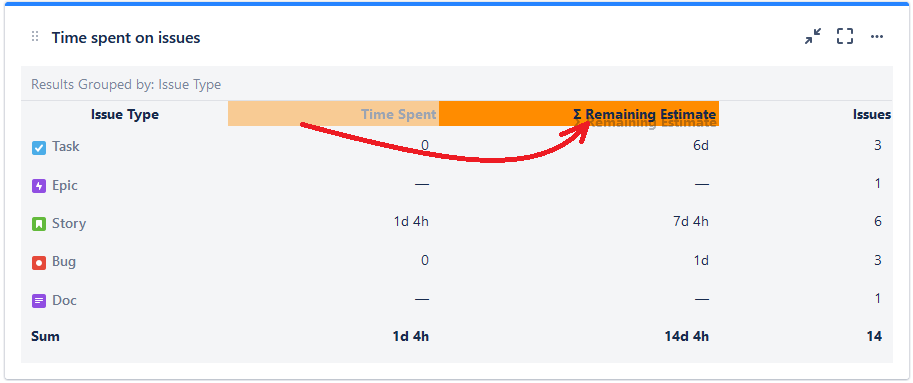
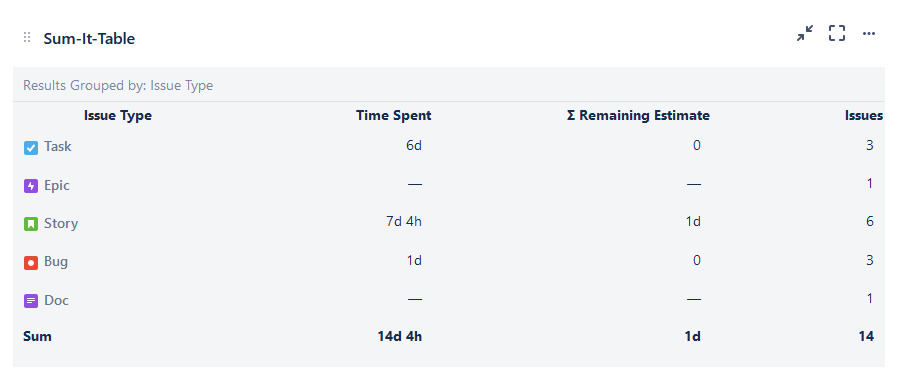
Sum up numbers in a table using gadget
Create tables containing data with multiple statistics. With this functionality, you can analyse whatever you need to.
You can use this simple table in order to tell how much time your developers spend on which type of activity during a specific Sprint, so that you have hard data for the Sprint Retrospective. Another use-case could be when you need to sum up amount of Story Points per your team spends on bugs each sprint, so that you can improve quality of your product. You can also view how much time was spent on each of the releases. This table can also be used to sum up story points related to a specific deployment based on which you can improve the quality of your product in the upcoming releases.
Configuration
- Go to dashboard on which you're willing to place the Gadget
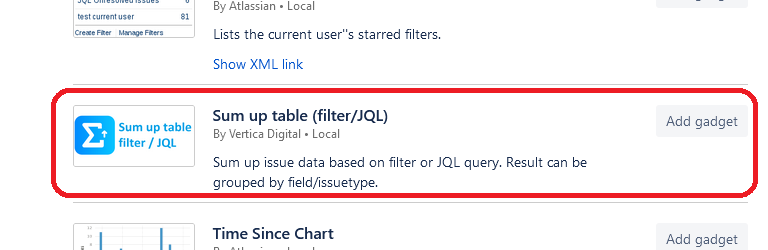
- Add Gadget called "Sum up table (filter/SQL)" to the dashboard
- Fill in the details on the gadget configuration screen
- Saved filter (optional)
- JQL - select data you want to show in the table
- Fields - select the fields you want to display in the table
- Group by - select parameter based on which you want to group your data.
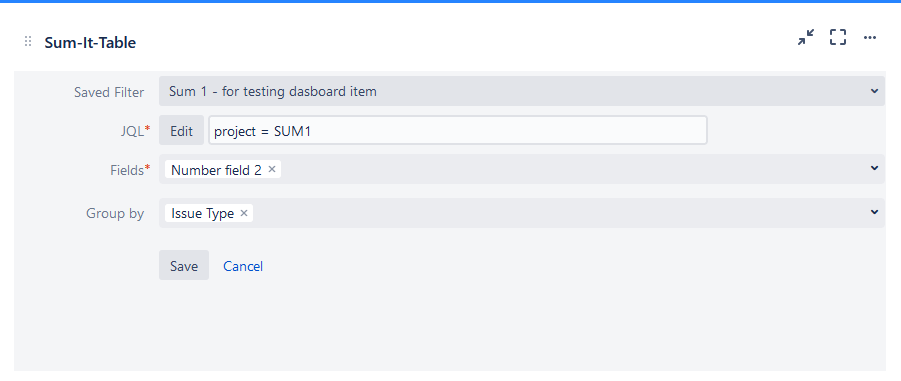
4. Click on button "Save" and now you see statistics you wanted :)
Changing row order
If you want to change order of the rows, you can use drag&drop functionality directly on the dashboard